Data Visualization
Communicate Through Visuals
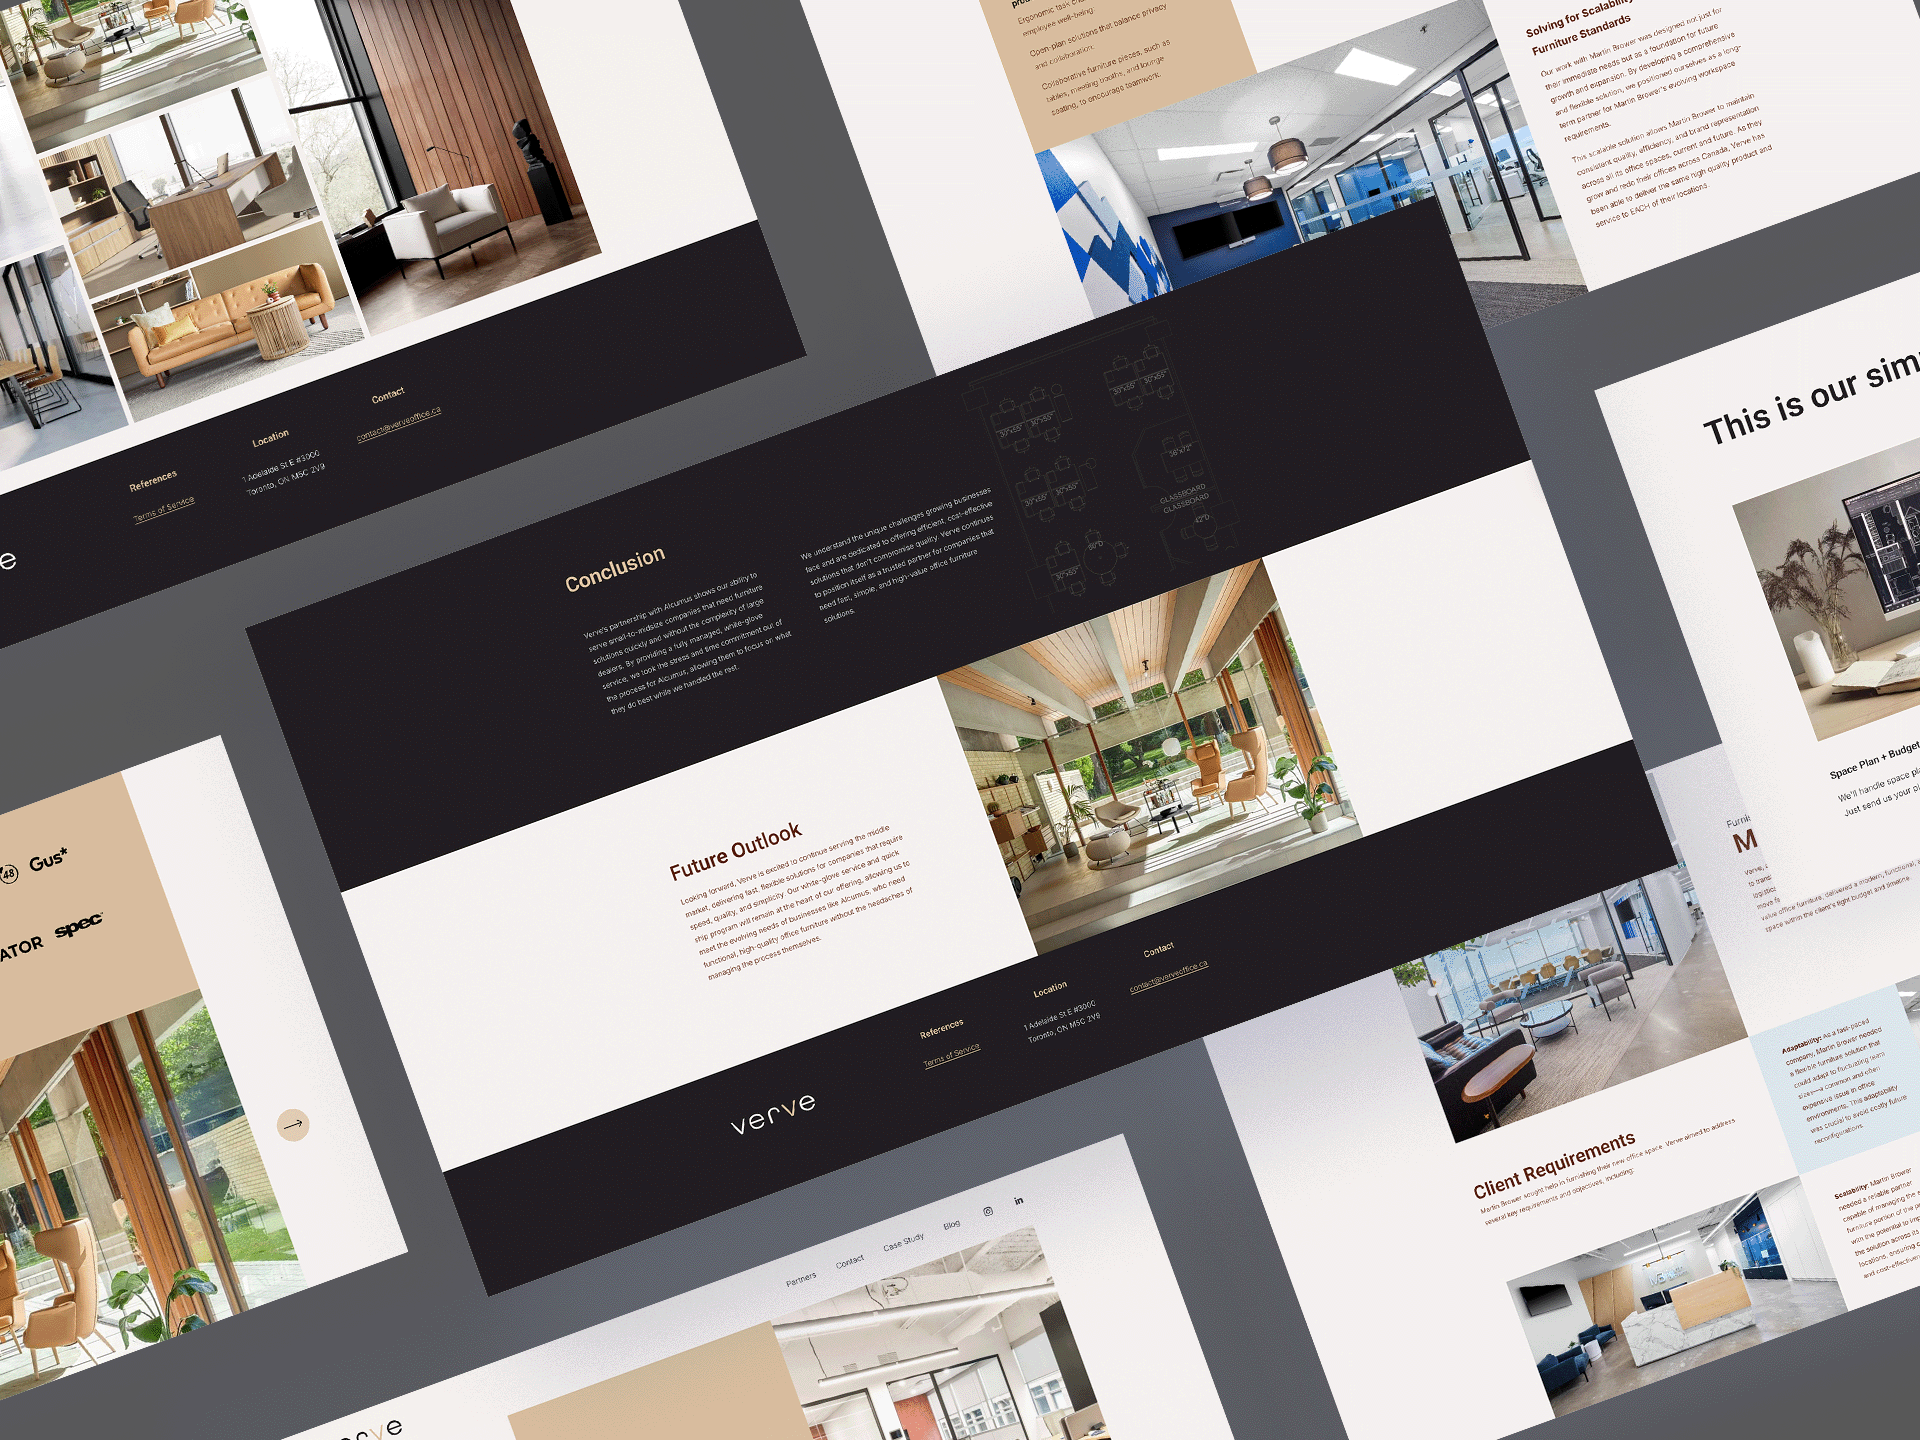
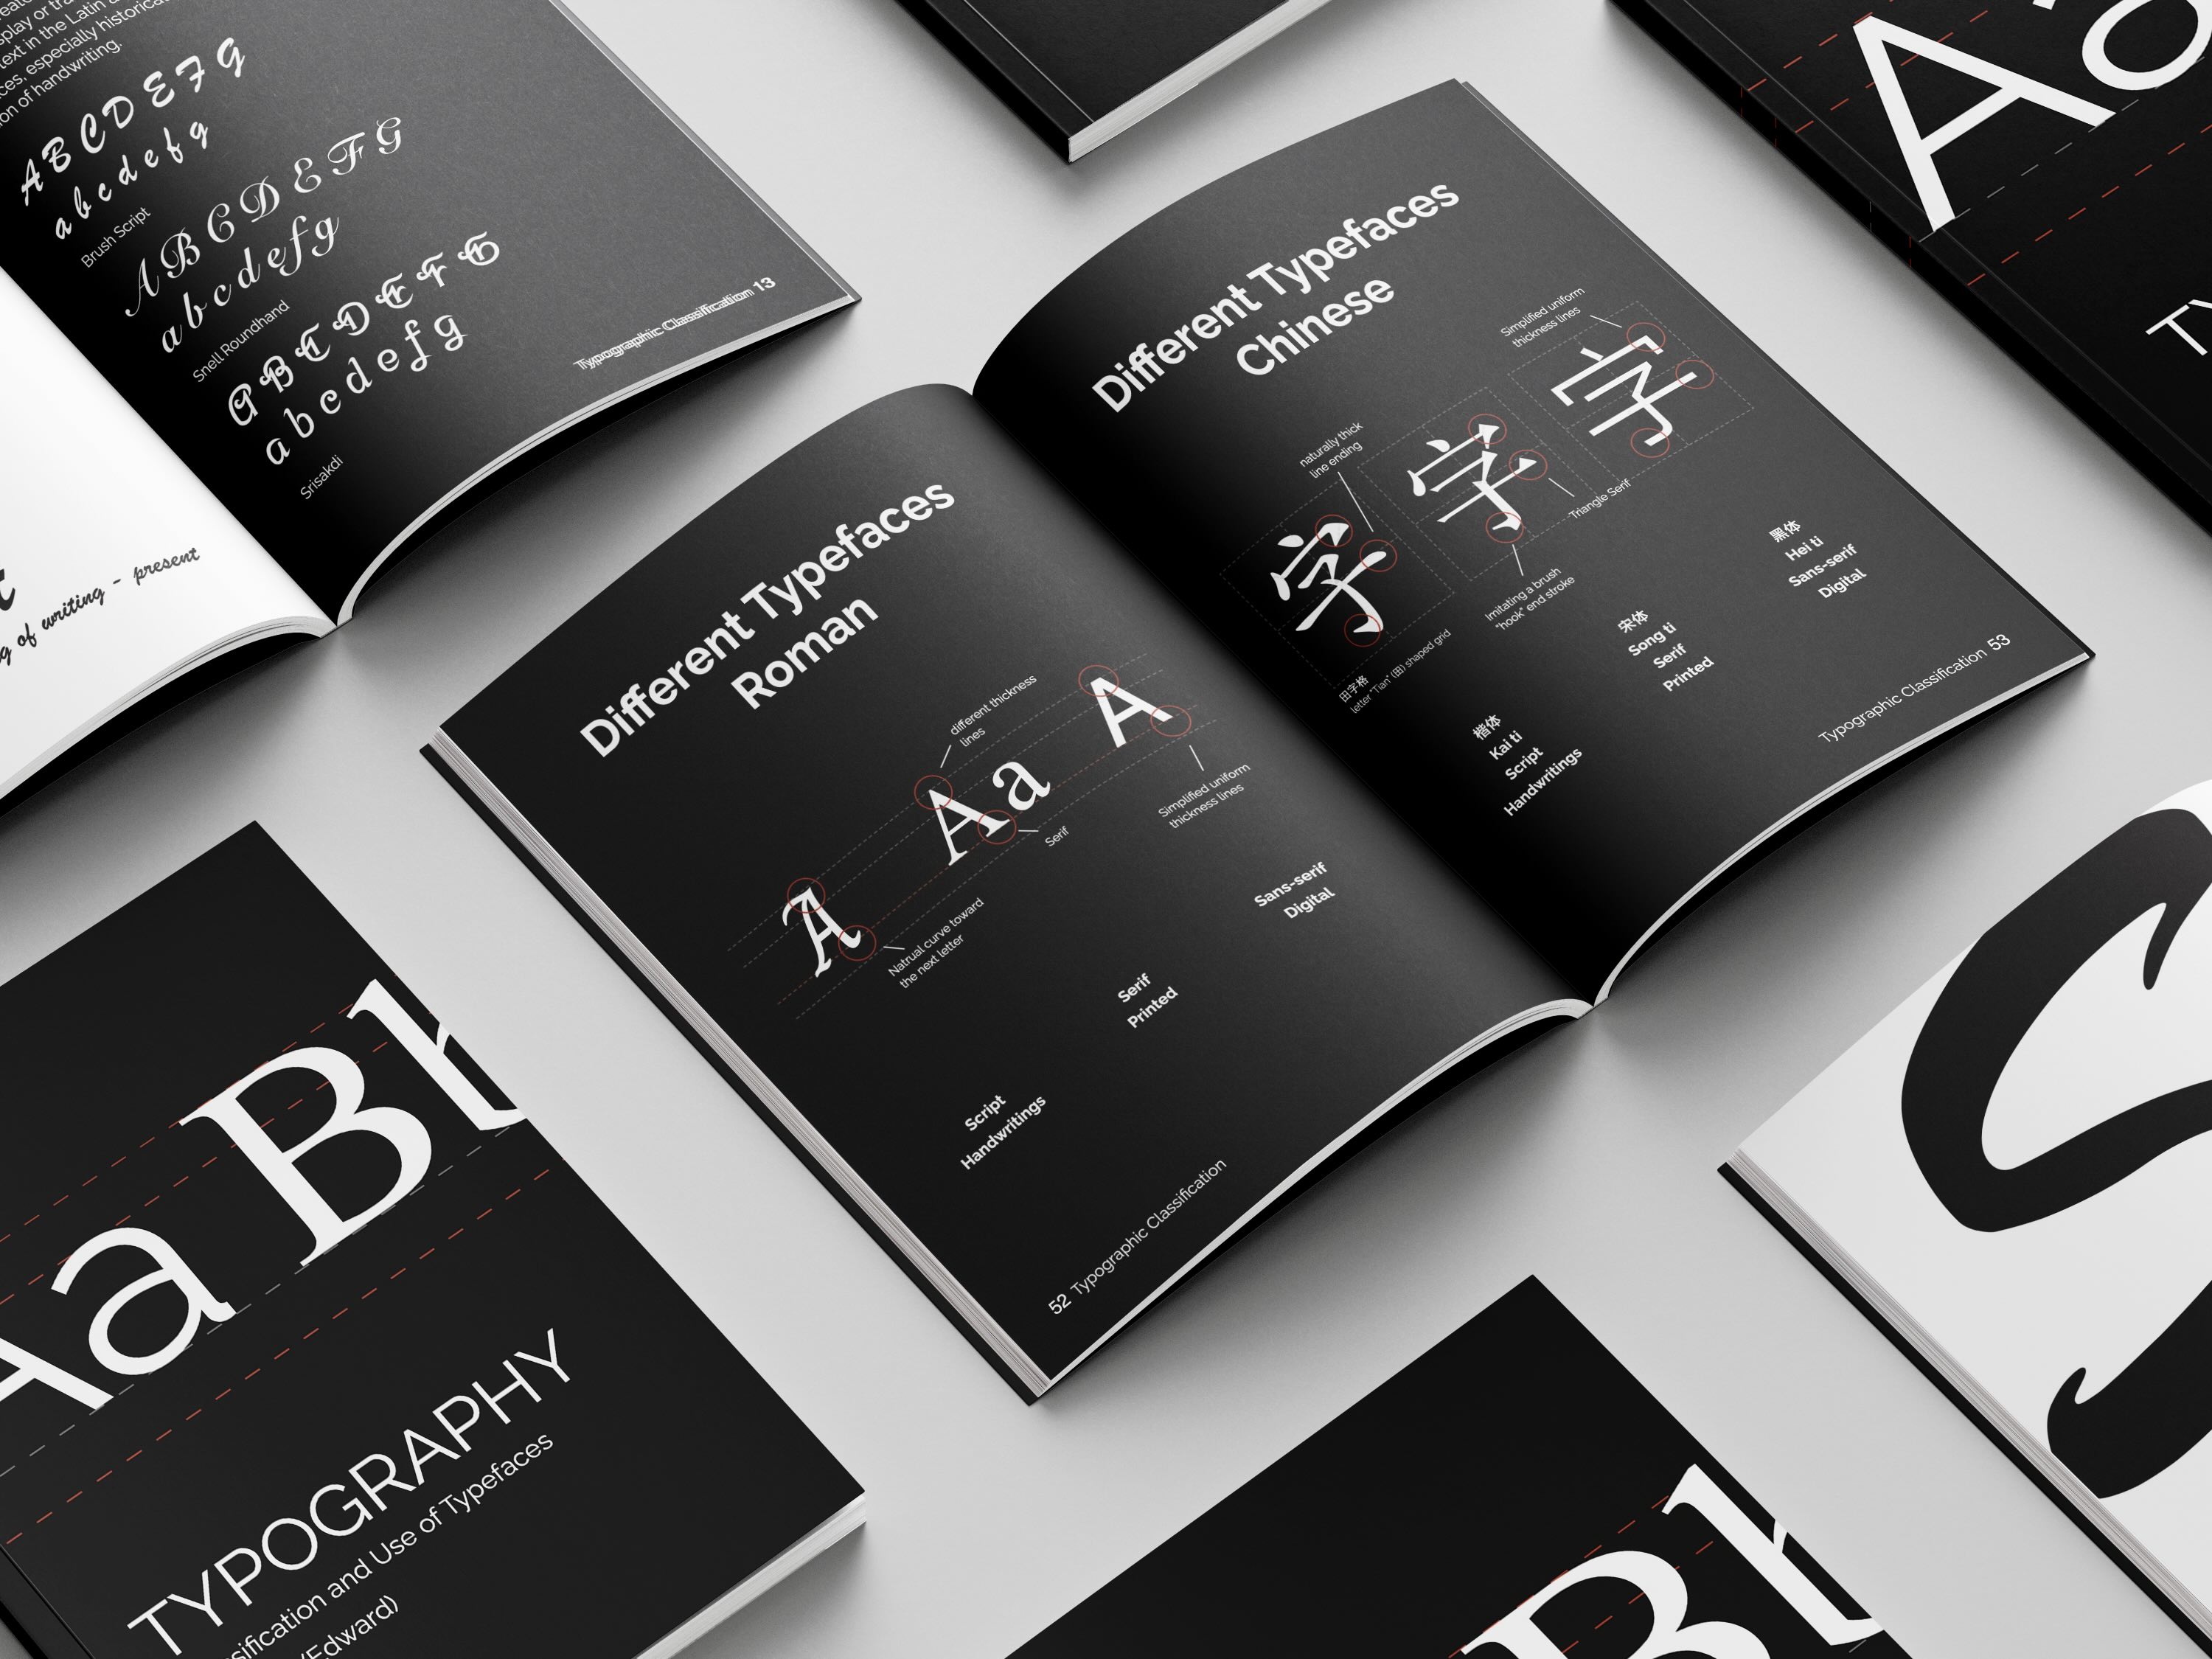
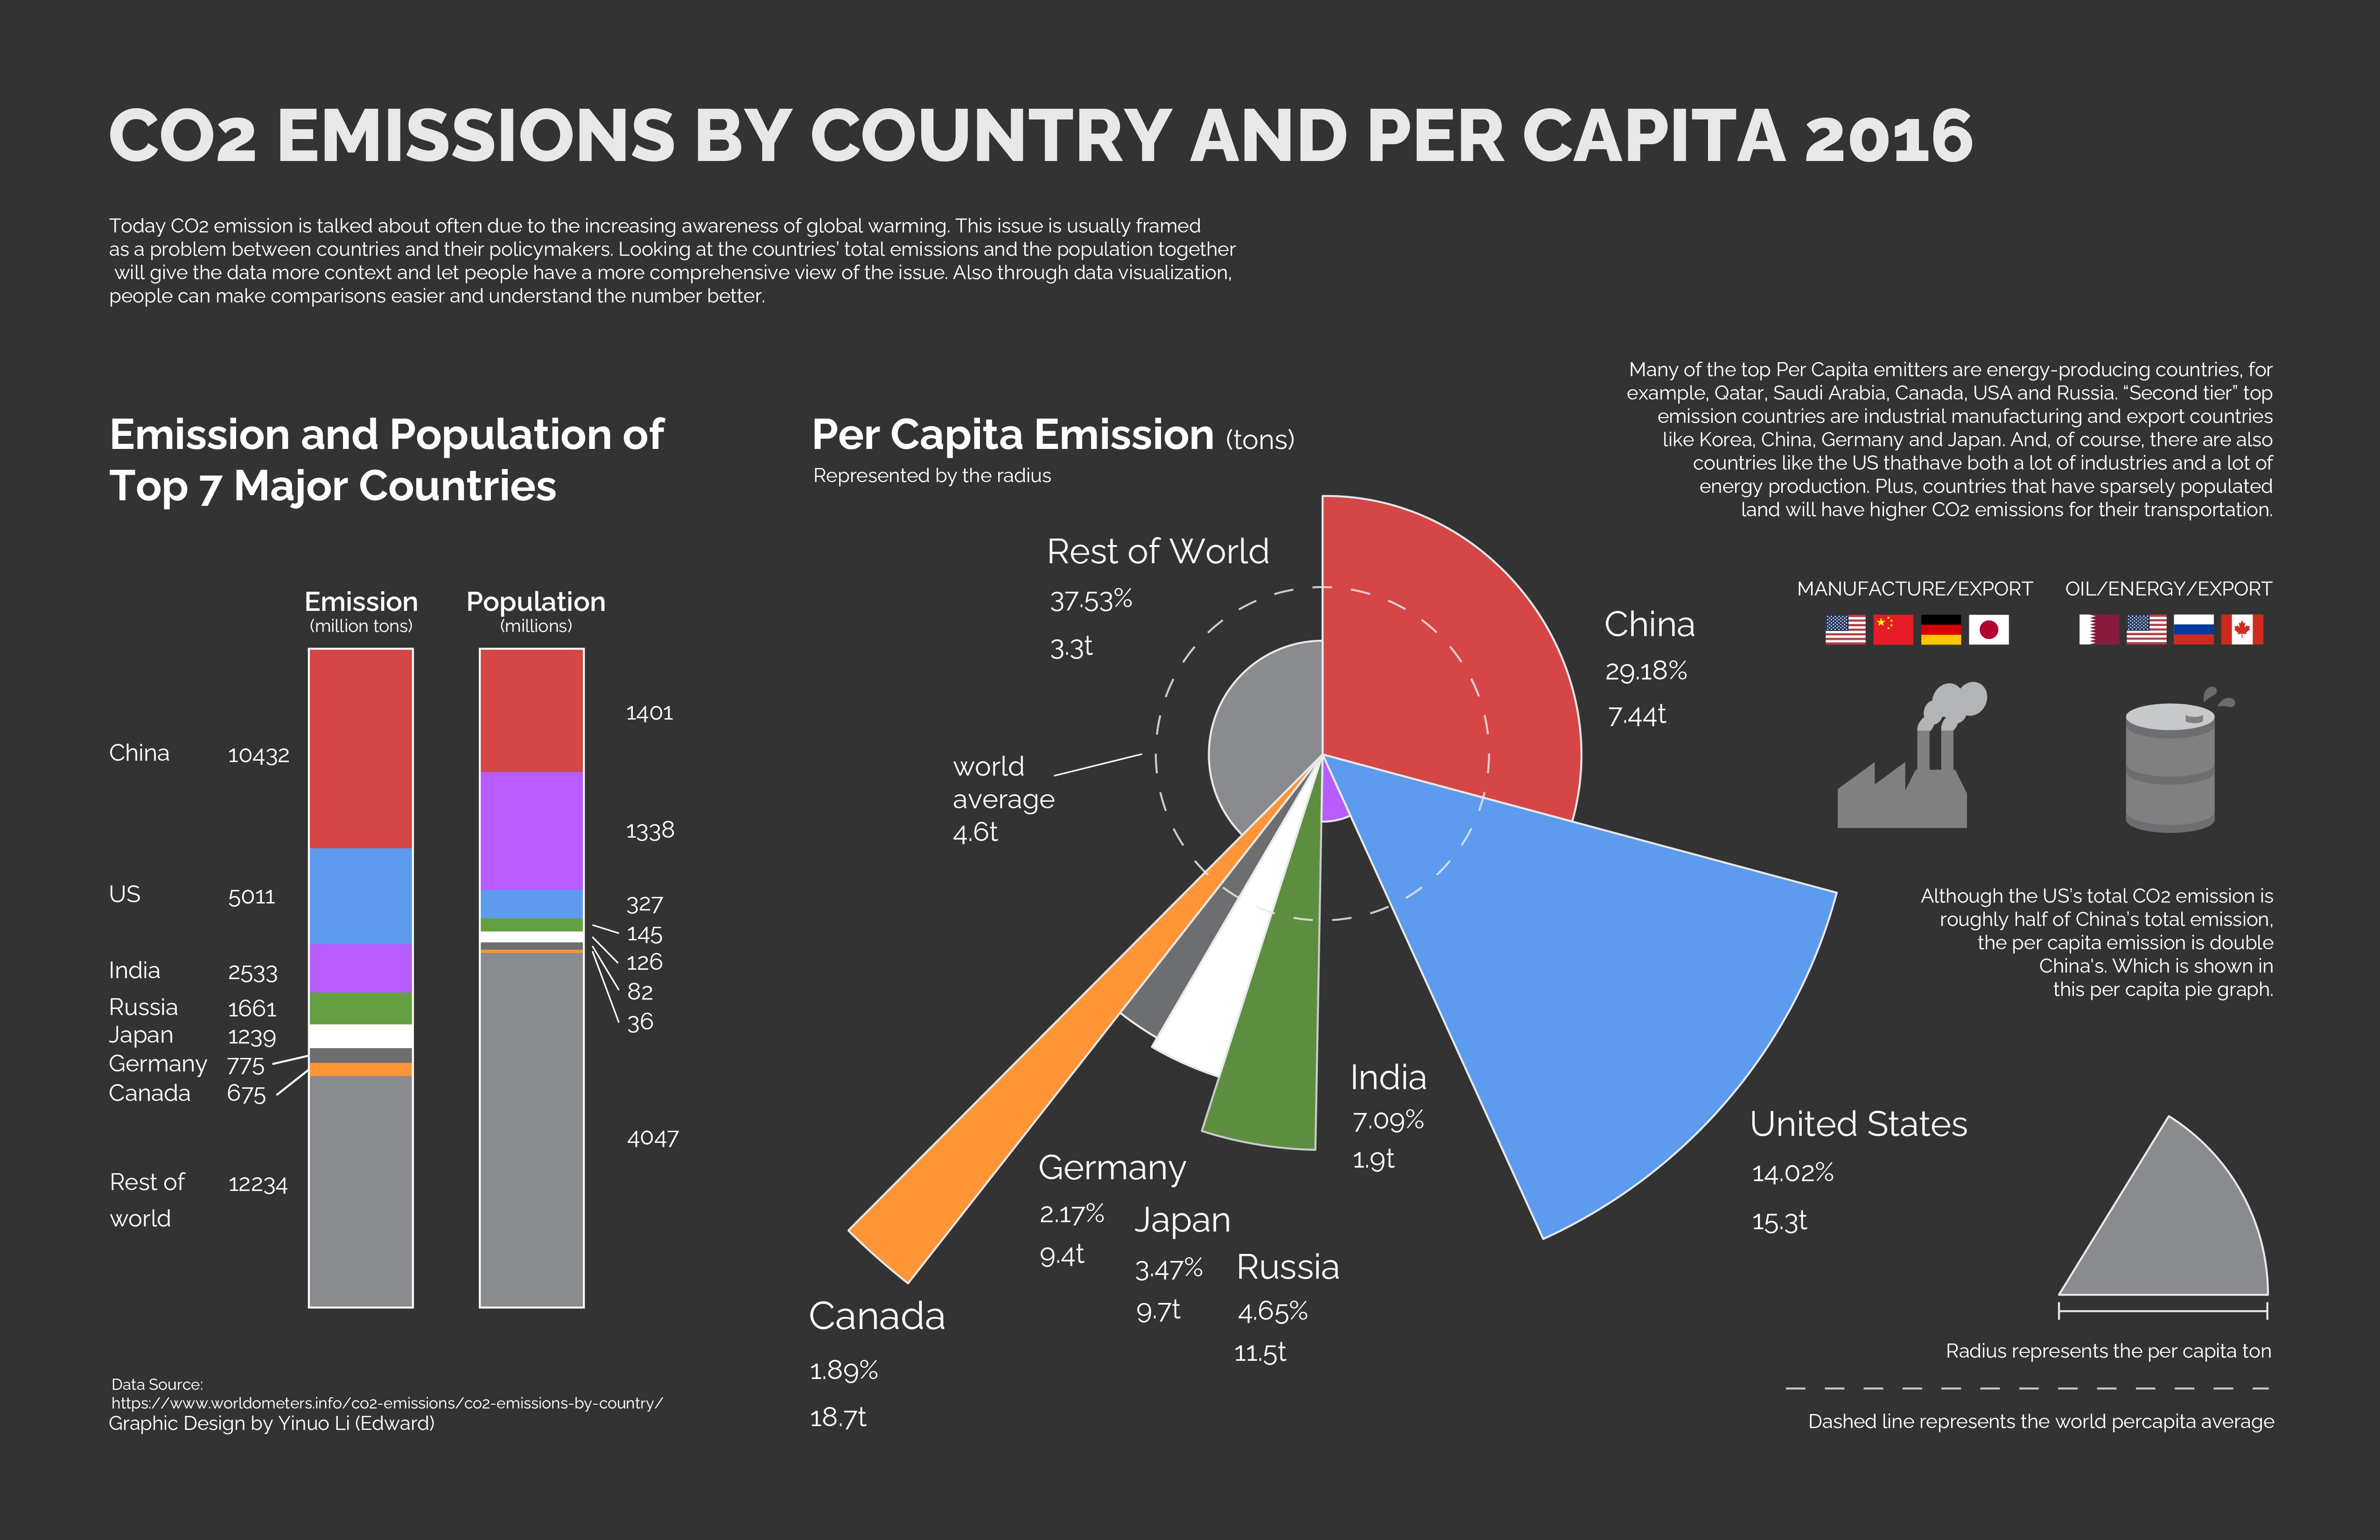
This project explores how data can be communicated through visual design rather than text alone. By combining charts, composition, and typography, I aimed to make information easier to read while also creating a strong visual impact.One piece focuses on presenting environmental data through a graph-based layout, using contrast and structure to make patterns more immediate and understandable. Another piece applies data visualization in a poster format, combining statistics, image-making, and typography to create a more expressive and engaging way of reading information.

Conclusion
Through this project, I explored how data visualization can function as both an analytical tool and a design system — helping viewers quickly understand information while maintaining clarity, rhythm, and visual interest.
See my work
Here are a few of my other projects. Feel free to explore.